# SLO Burn-Rate Alerts: Stop Paging 54 Minutes After Recovery
> A 1h burn-rate alert kept firing 54 minutes after errors stopped. Add a 5m short window in Prometheus, prove it with promtool, and page only while budget burns.
- URL: https://blog.sanjayhona.com.np/slo-burn-rate-alerts-prometheus/
- Author: Sanjay Hona (https://sanjayhona.com.np)
- Published: 2026-11-04
- Tags: sre, prometheus, alerting, slo, observability
## Key takeaways
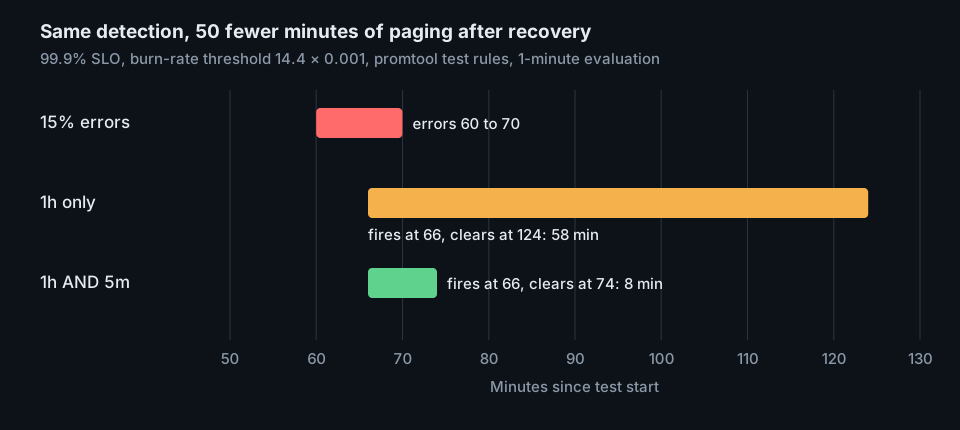
- A burn-rate alert on a single 1h window kept firing for 54 minutes after a 10-minute burst of 15% errors ended, in a promtool 3.15.1 run.
- Adding a 5m short window with the same 14.4x threshold, joined with and, detected the burst at the same minute and cleared 4 minutes after the errors stopped.
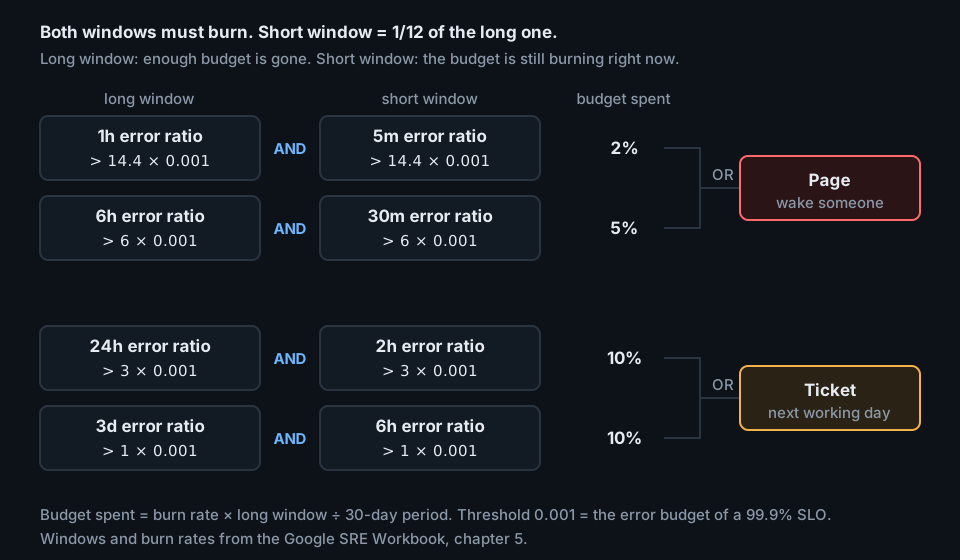
- The Google SRE Workbook recommends four window pairs for a 99.9% SLO: 1h/5m at 14.4x and 6h/30m at 6x for pages, 24h/2h at 3x and 3d/6h at 1x for tickets.
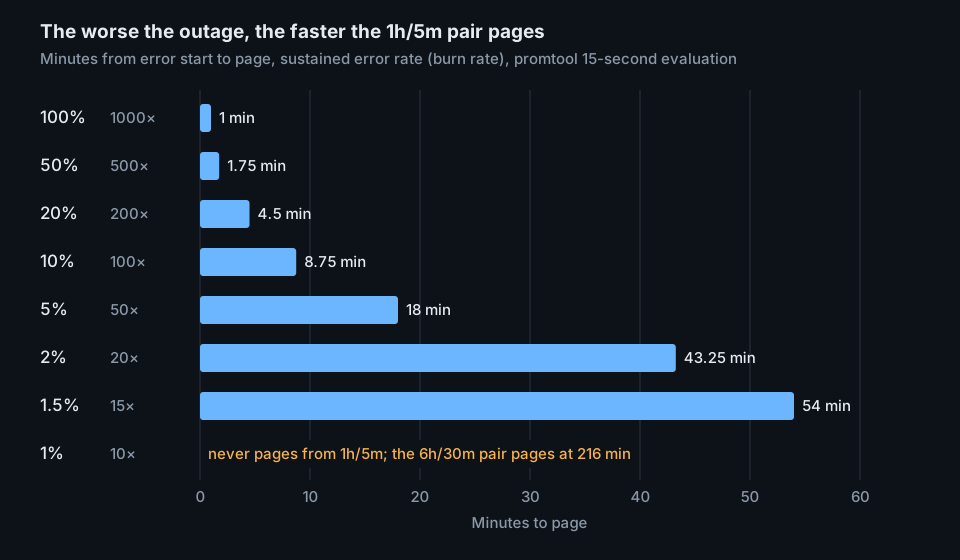
- A sustained 1% error rate never trips the 1h/5m pair, but the 6h/30m pair pages after 216 minutes, which matches the Workbook detection-time formula.
- Put SLO recording rules and the alerts that read them in the same Prometheus rule group, so each alert sees values recorded at the same evaluation time.
A burn-rate alert on a one-hour window kept paging for 54 minutes after the errors stopped. Running a 10-minute burst of 15% errors through `promtool test rules` shows it: the alert fires 6 minutes in, then stays red while the one-hour average slowly drains. Adding a second, short window to the same rule fixes the reset time without delaying detection, and the [Google Site Reliability Engineering (SRE) Workbook chapter on alerting on service level objectives (SLOs)](https://sre.google/workbook/alerting-on-slos/) gives the exact windows and thresholds to use.
Each pair fires only when the long window says enough budget is gone and the short window says it is still going. Source: Google SRE Workbook, Alerting on SLOs.
## What burn rate measures
The Workbook defines it plainly: "Burn rate is how fast, relative to the SLO, the service consumes the error budget." For a 99.9% SLO over 30 days, the error budget is 0.1% of requests. A constant 0.1% error rate is a burn rate of 1 and spends the whole budget in exactly 30 days.
The Workbook's Table 5-4 shows how fast higher rates empty the budget:
| Burn rate | Error rate (99.9% SLO) | Time to exhaust 30-day budget |
| --- | --- | --- |
| 1 | 0.1% | 30 days |
| 2 | 0.2% | 15 days |
| 10 | 1% | 3 days |
| 1,000 | 100% | 43 minutes |
The budget spent by the time an alert fires is `burn rate × window ÷ period`. A 14.4x burn over 1 hour of a 720-hour month is 2% of the budget. That is where the 14.4 threshold comes from.
## Where the common alerts break
Before it gets there, the Workbook walks through simpler rules and names each one's failure:
| Rule | What goes wrong (per the Workbook) |
| --- | --- |
| 10m error ratio at or above 0.001 | "A 0.1% error rate for 10 minutes would alert, while consuming only 0.02% of the monthly error budget." |
| 1m error ratio above 0.001 with `for: 1h` | "a 100% outage alerts after one hour, the same detection time as a 0.2% outage." |
| 1h ratio above 36 × 0.001 | "A 35x burn rate never alerts, but consumes all of the 30-day error budget in 20.5 hours." and "Reset time: 58 minutes is still too long." |
The third rule is the interesting one. Burn rate fixed precision and detection. What it left broken is reset time: how long the alert keeps firing after the problem is gone. The Workbook's warning: "Long reset times can lead to confusion or to issues being ignored."
## The fix: a short window that must agree
The Workbook's sixth approach adds a short window to each long one: "A good guideline is to make the short window 1/12 the duration of the long window." The alert needs both windows above the same threshold. The long window proves enough budget is gone. The short window proves the burn is still happening.
Here is the rule file used for the lab below. It records the error ratio over 5m and 1h, then defines two page alerts: the 1h-only version and the 1h AND 5m version from the Workbook.
```yaml
groups:
- name: slo
rules:
- record: job:slo_errors_per_request:ratio_rate5m
expr: sum by (job) (rate(http_requests_total{code=~"5.."}[5m])) / sum by (job) (rate(http_requests_total[5m]))
- record: job:slo_errors_per_request:ratio_rate1h
expr: sum by (job) (rate(http_requests_total{code=~"5.."}[1h])) / sum by (job) (rate(http_requests_total[1h]))
- alert: ErrorBudgetBurn1hOnly
expr: job:slo_errors_per_request:ratio_rate1h{job="myjob"} > (14.4*0.001)
labels:
severity: page
- alert: ErrorBudgetBurn1h5m
expr: |
job:slo_errors_per_request:ratio_rate1h{job="myjob"} > (14.4*0.001)
and
job:slo_errors_per_request:ratio_rate5m{job="myjob"} > (14.4*0.001)
labels:
severity: page
```
## Proving it with promtool test rules
[`promtool test rules`](https://prometheus.io/docs/prometheus/latest/configuration/unit_testing_rules/) replays synthetic series through your rules and checks which alerts fire at which time. No Prometheus server or real traffic needed. The test below feeds 1,000 requests per minute, with 150 of them failing (15%) from minute 60 to minute 70. The series use promtool's expanding notation, where `'a+bxn'` means start at `a`, then `n` more samples each `b` higher.
```yaml
rule_files: [rules.yml]
evaluation_interval: 1m
tests:
- name: "15% errors for 10 minutes on a 99.9% SLO"
interval: 1m
input_series:
- series: 'http_requests_total{job="myjob",code="200"}'
values: '0+1000x60 60850+850x9 69500+1000x60'
- series: 'http_requests_total{job="myjob",code="500"}'
values: '0x60 150+150x9 1500x60'
alert_rule_test:
- {eval_time: 65m, alertname: ErrorBudgetBurn1h5m, exp_alerts: []}
- eval_time: 66m
alertname: ErrorBudgetBurn1h5m
exp_alerts: [{exp_labels: {job: myjob, severity: page}}]
- eval_time: 73m
alertname: ErrorBudgetBurn1h5m
exp_alerts: [{exp_labels: {job: myjob, severity: page}}]
- {eval_time: 74m, alertname: ErrorBudgetBurn1h5m, exp_alerts: []}
- eval_time: 123m
alertname: ErrorBudgetBurn1hOnly
exp_alerts: [{exp_labels: {job: myjob, severity: page}}]
- {eval_time: 124m, alertname: ErrorBudgetBurn1hOnly, exp_alerts: []}
```
Running it with promtool 3.15.1 (the sha256 of the tarball matched the one on the prometheus.io download page) shows both files are valid and every expectation holds:
```text
$ promtool check rules rules.yml
Checking rules.yml
SUCCESS: 4 rules found
$ promtool test rules slo_test.yml
SUCCESS
```
Expecting the 1h-only alert to clear at minute 74, when the errors have been gone for 4 minutes, fails. The output shows it still paging:
```text
$ promtool test rules wrong.yml
FAILED:
name: 15% errors for 10 minutes on a 99.9% SLO,
alertname: ErrorBudgetBurn1hOnly, time: 1h14m,
exp:[],
got:[
0:
Labels:{alertname="ErrorBudgetBurn1hOnly", job="myjob", severity="page"}
Annotations:{}
]
```
Querying `ALERTS{alertstate="firing"}` at every minute of the same run gives the full picture:
Both alerts fire at minute 66. Only the one with a 5m window clears when the errors stop. Source: promtool 3.15.1 run of the test above, one-minute evaluation.
Detection is identical because the 5m ratio crosses 1.44% almost at once during a 15% burst, so the 1h window is the slower condition either way. The Workbook describes the same shape for its Figure 5-6: the short window "drops below the threshold 5 minutes after the errors stop, at which point the alert stops firing."
## How fast the 1h/5m pair pages at each error rate
The same test setup at 15-second evaluation, with errors starting after an hour of clean traffic (seven hours for the 6h/30m run) and never stopping, measures time to page for the 1h AND 5m rule:
A total outage pages in a minute. A 1% error rate (10x burn) is too slow for the 1h pair, which is why the 6h/30m pair exists. Source: promtool 3.15.1 runs, 15-second evaluation, 99.9% SLO.
The Workbook's formula for time to fire is `(1 − SLO) ÷ error ratio × window × burn rate`. For 1% errors on the 6h/30m pair that is 0.001 ÷ 0.01 × 6h × 6 = 3.6 hours, and the promtool run paged at exactly 216 minutes. A 1% error rate empties the budget in 3 days, so 3.6 hours is early enough to act on.
## The full recommended set
The Workbook's Table 5-8 lists the starting parameters for a 99.9% SLO. Its example rules also add a 24h/2h pair at 3x to the ticket alert.
| Severity | Long window | Short window | Burn rate | Budget consumed |
| --- | --- | --- | --- | --- |
| Page | 1 hour | 5 minutes | 14.4 | 2% |
| Page | 6 hours | 30 minutes | 6 | 5% |
| Ticket | 3 days | 6 hours | 1 | 10% |
Write the page pairs as one alert joined with `or`, and the ticket pairs as another, exactly as the Workbook's expressions do. One alert per severity keeps a big incident from paging once per pair. The Workbook's example: a 10% budget spend in five minutes also trips the 6h and 1h conditions, and that "will trigger three notifications unless the monitoring system is smart enough to prevent it."
Replace `0.001` with your own budget (1 − SLO) in every threshold. The burn rates stay the same for any 30-day SLO, since they are defined relative to the budget.
## One rule group, not two
The first version of this lab put the recording rules in one group and the alerts in another. Repeated runs then disagreed by one evaluation: the 1h/5m alert sometimes fired at minute 67 instead of 66, and the 1h-only alert sometimes cleared at minute 125. Moving everything into a single group made every run identical. The [Prometheus recording rules docs](https://prometheus.io/docs/prometheus/latest/configuration/recording_rules/) state the guarantee that matters: "Rules within a group are run sequentially at a regular interval, with the same evaluation time." Across groups the docs make no such promise, so keep each SLO's recording rules and alerts together.
## When traffic is low
Burn-rate math assumes enough requests for a ratio to mean something. The Workbook's example: at 10 requests per hour, one failed request is a 10% hourly error rate, "a 1,000x burn rate" that "would page immediately, as it consumed 13.9% of the 30-day error budget." Its suggestions for this case include generating artificial traffic and combining smaller services into one monitored group. Run the promtool test at your real off-peak request rate before trusting these thresholds at night.
## What to do
1. List your SLO page alerts and find any that use a single window, a static threshold, or `for:` as the main condition.
2. Add recording rules for the error ratio over 5m, 30m, 1h, 2h, 6h, 24h, and 3d, in the same rule group as the alerts that read them.
3. Rewrite the page alert as `(1h and 5m above 14.4 × budget) or (6h and 30m above 6 × budget)`, and the ticket alert as `(24h and 2h above 3 × budget) or (3d and 6h above 1 × budget)`.
4. Write a `promtool test rules` file with a short error burst and assert both the minute the page fires and the minute it clears. Run it in continuous integration (CI) next to `promtool check rules`.
5. Replay one past incident's real error rate through the same test and confirm the page would have fired in time and cleared once the fix landed.